Cloudwatch List
Amazon CloudWatch is a service for resource monitoring and management on the AWS platform. CloudWatch allows users to monitor metrics and logs of various AWS services such as EC2, RDS, S3, ECS, SES, etc. and allows users to create alarms and notifications when changes or interference occur in the system or application.
Arkademi's Cloudwatch
Cloudwatch in arkademi itself includes what has been explained above, which functions to monitor metrics & logs for each service used.
- Metrics (Monitor CPU Utilization, Memory Utilization, Disk Usage, etc.)
- Logs
Dashboard
The image below is an illustration of the cloudwatch service dashboard display.
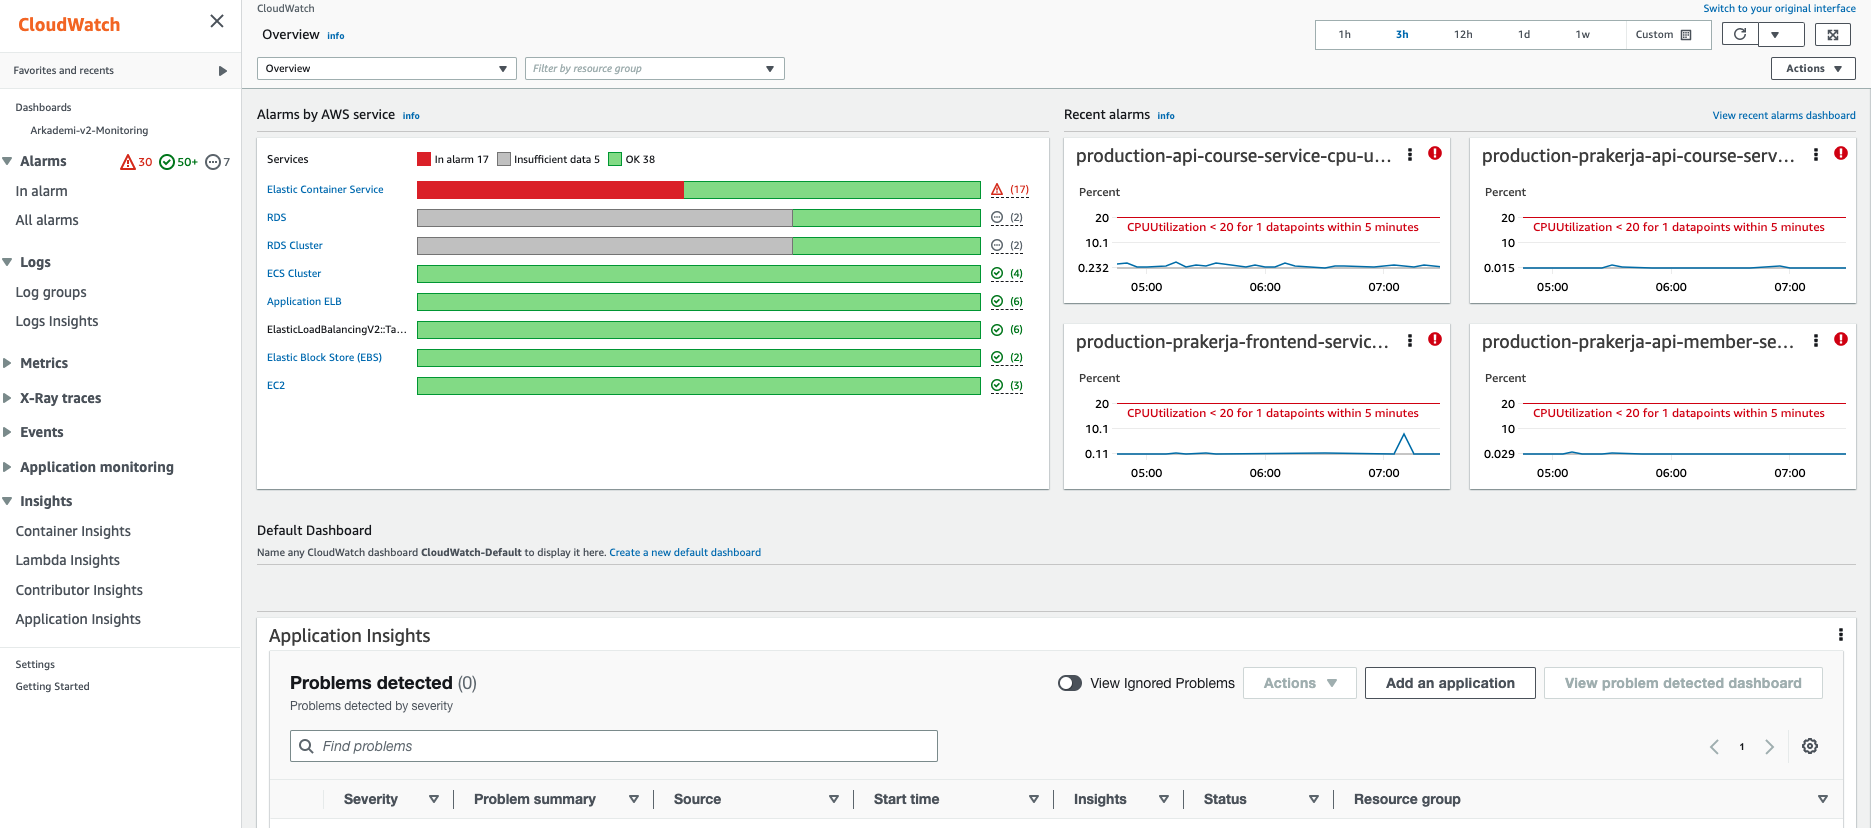
Cloudwatch has a feature called dashboard that works if you want to make monitoring one or more services into one dashboard.

The picture above shows several dashboards to monitor some of the services we use. For example, to see the details, please click Arkademi-v2-Monitoring.
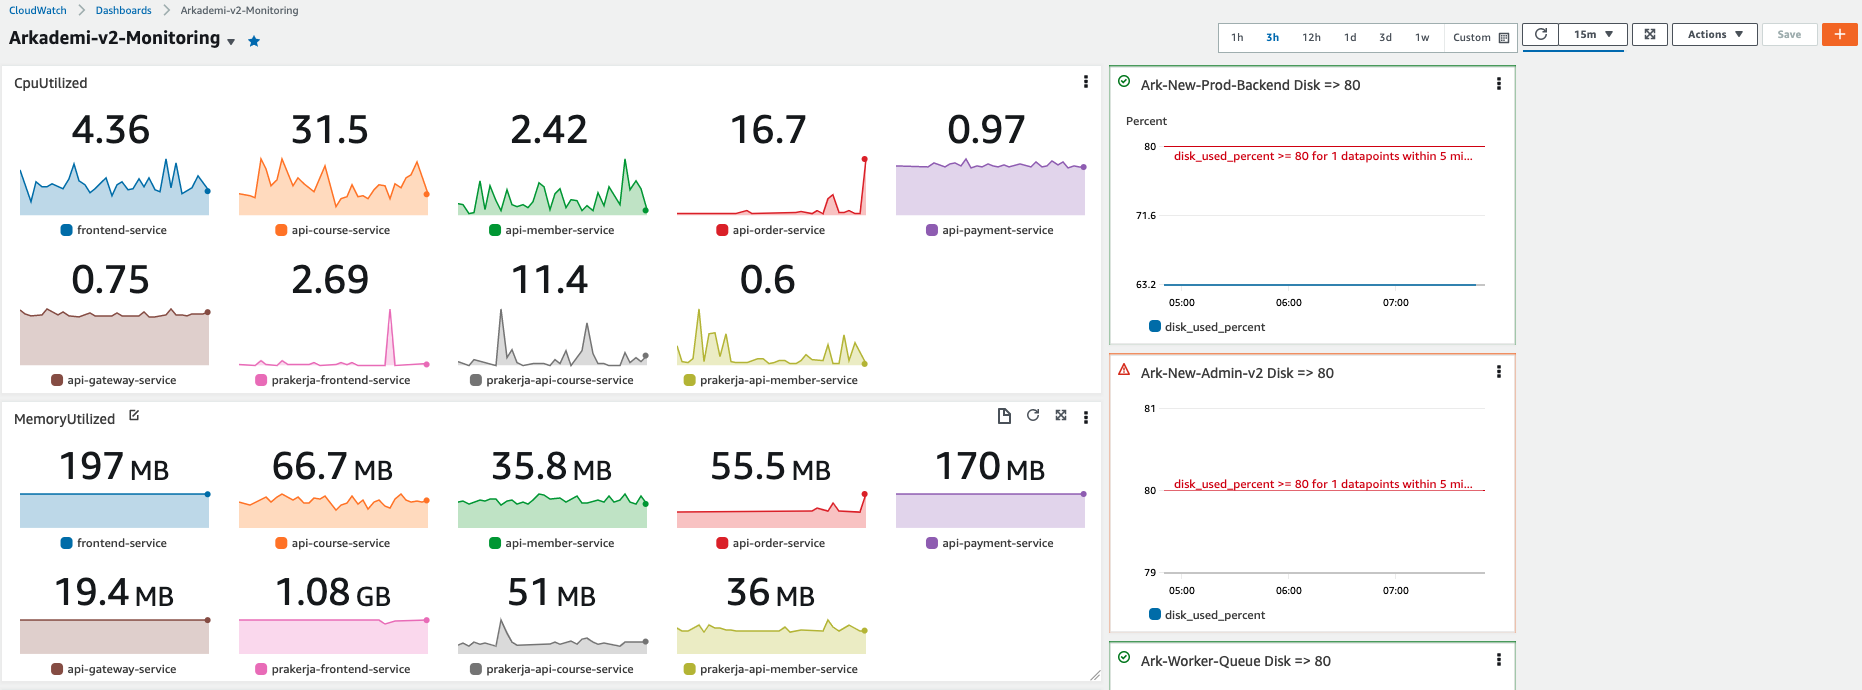


In one of the dashboards you can enter as many metrics or logs as you want. Then you can set the time history of the metrics / logs on the dashboard. From the dashboard above there are several monitoring metrics for CPU Utilization, Memory Utilization, Disk Usage, Logs that are running in the current arcademy application.
Add Metrics to Dashbord
In this section, we will explain how to add metrics to the dashboard. For example, you will be guided to add RDS Database metrics to the Arkademi-v2-Monitoring dashboard, click the orange + button in the right corner.

Next we can choose widgets with various models provided by cloudwatch. For now, use Line.

Then select metrics.

Then the metrics option will appear as shown below and you can view and select any metrics available to be included in the dashboard. Next select RDS.

In RDS, a view will appear based on existing metrics, classes, engines. Select Per-Database Metrics.
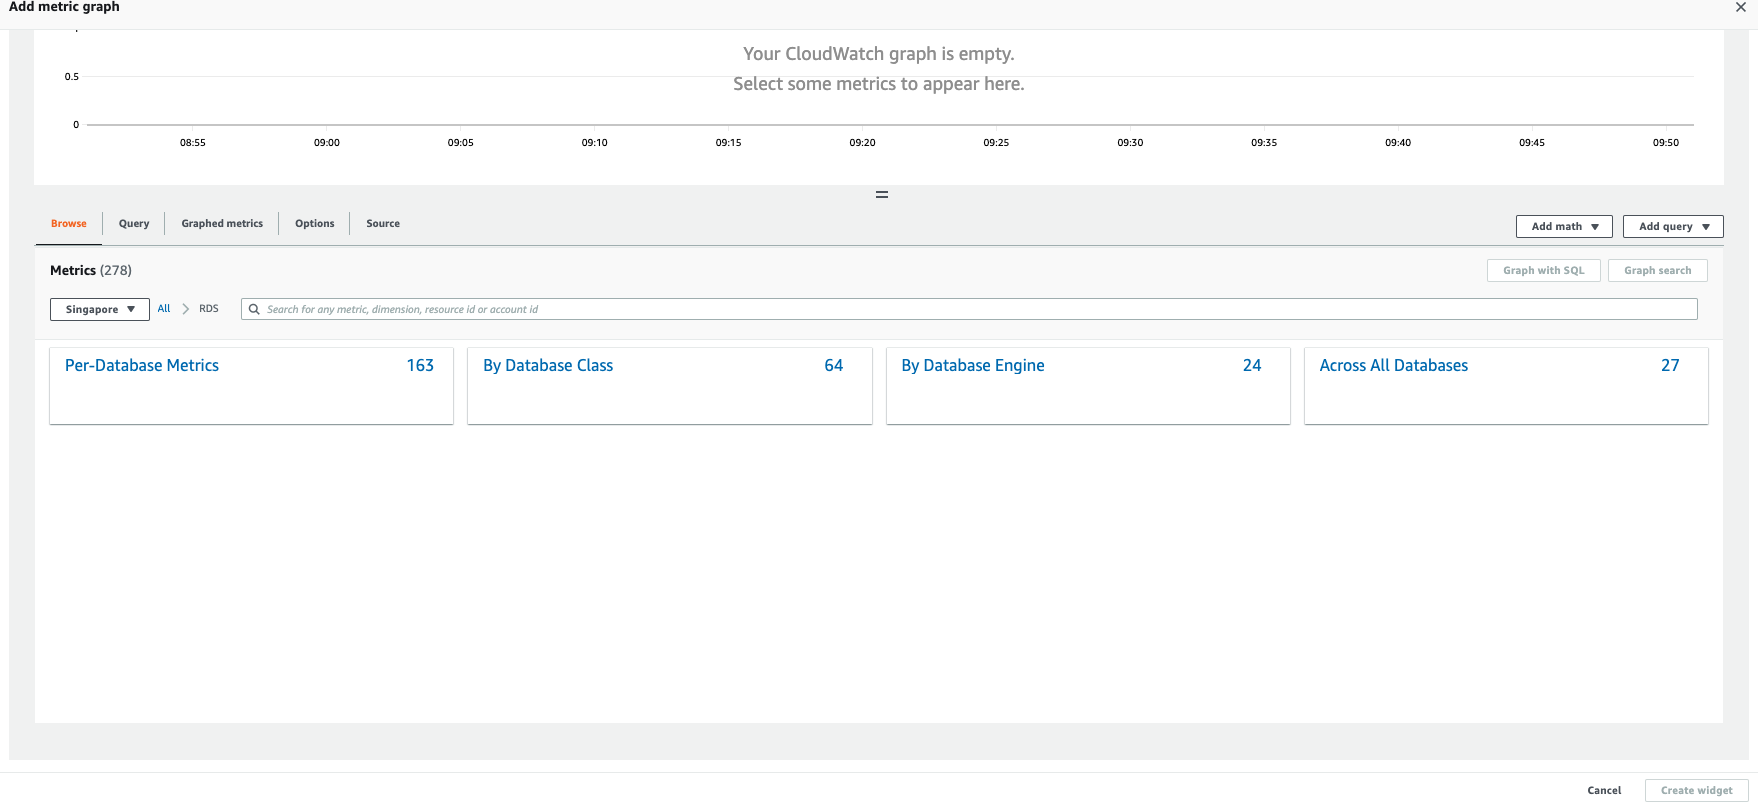
Furthermore, there are many metric names available.
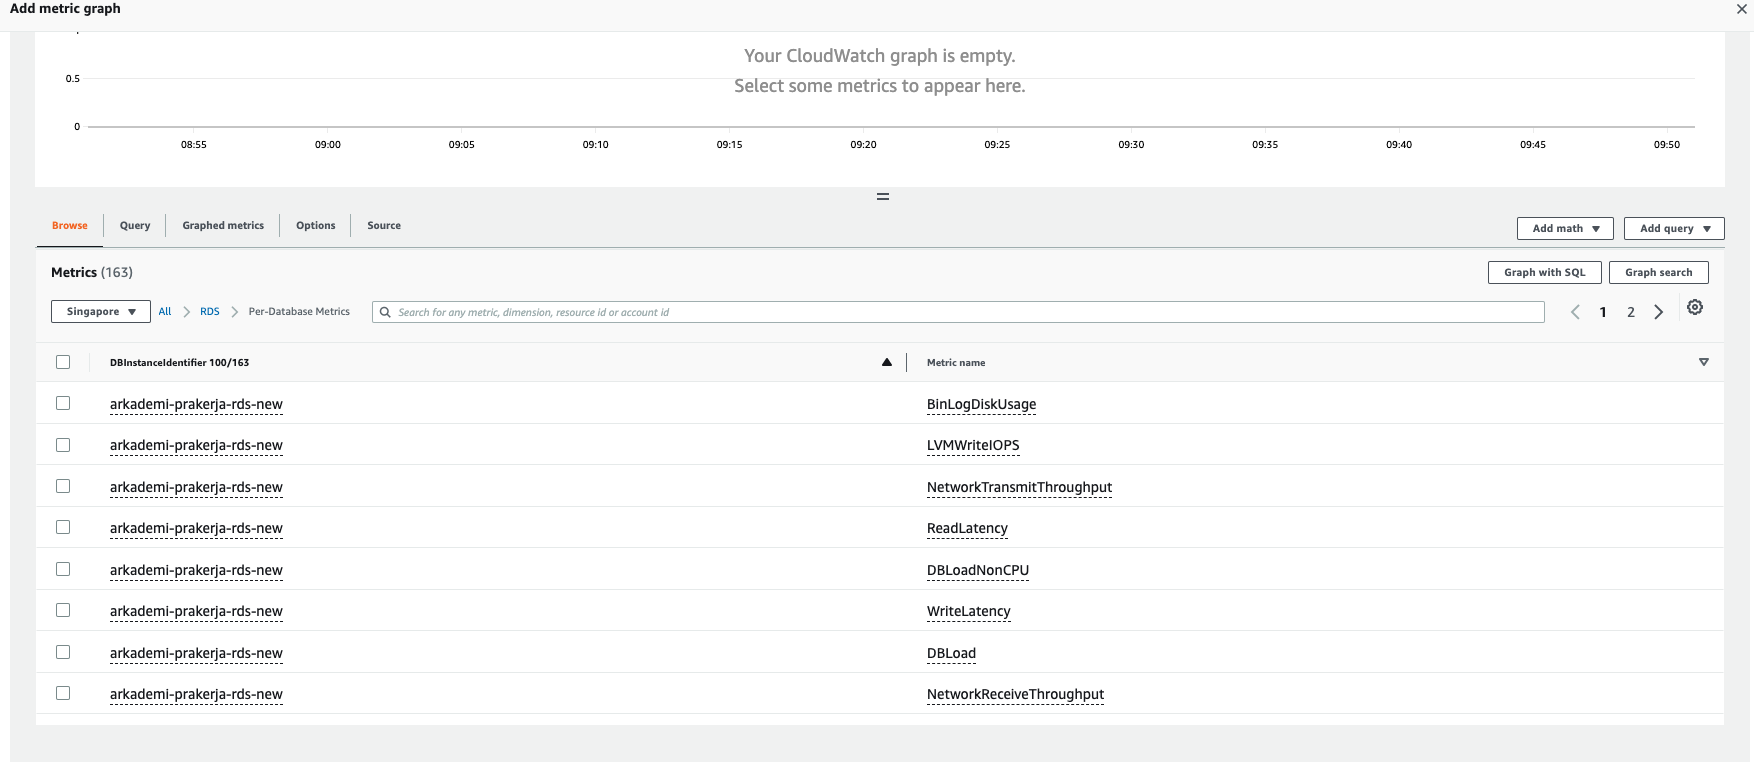
If we want to monitor the CPU used by RDS. Below there is a DBInstanceIdentifier and search for the Production Database, namely arkademi-v2-prod-db with the metric name CPUUtilization, you can use the search feature to find metrics, name identifiers, etc. as shown below.
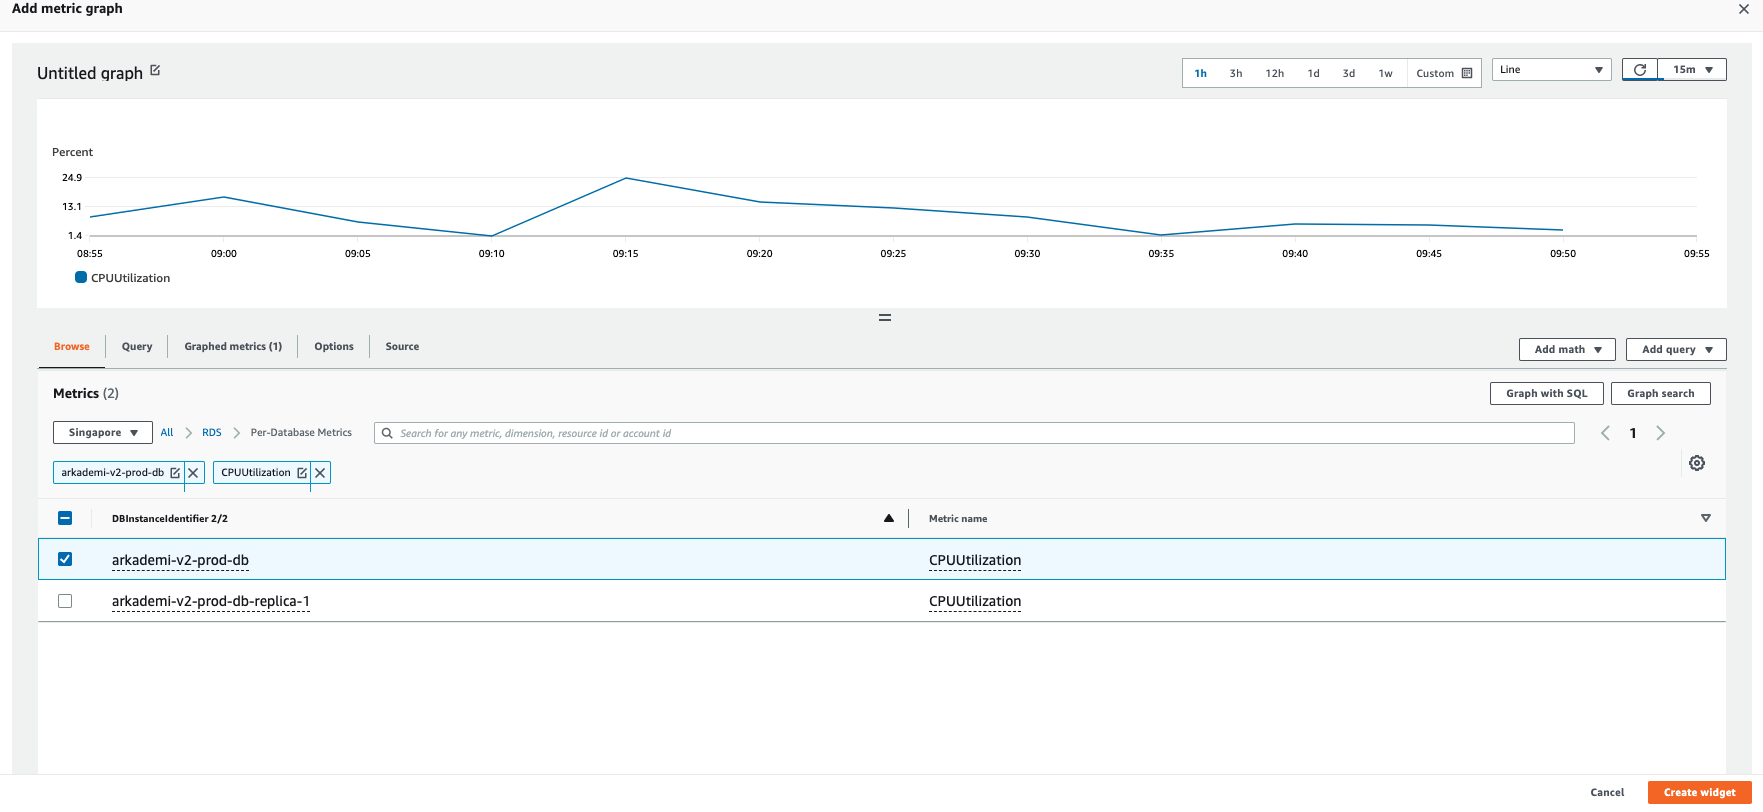
If it is found, then click Create Widget. The widget will automatically appear on our dashboard.
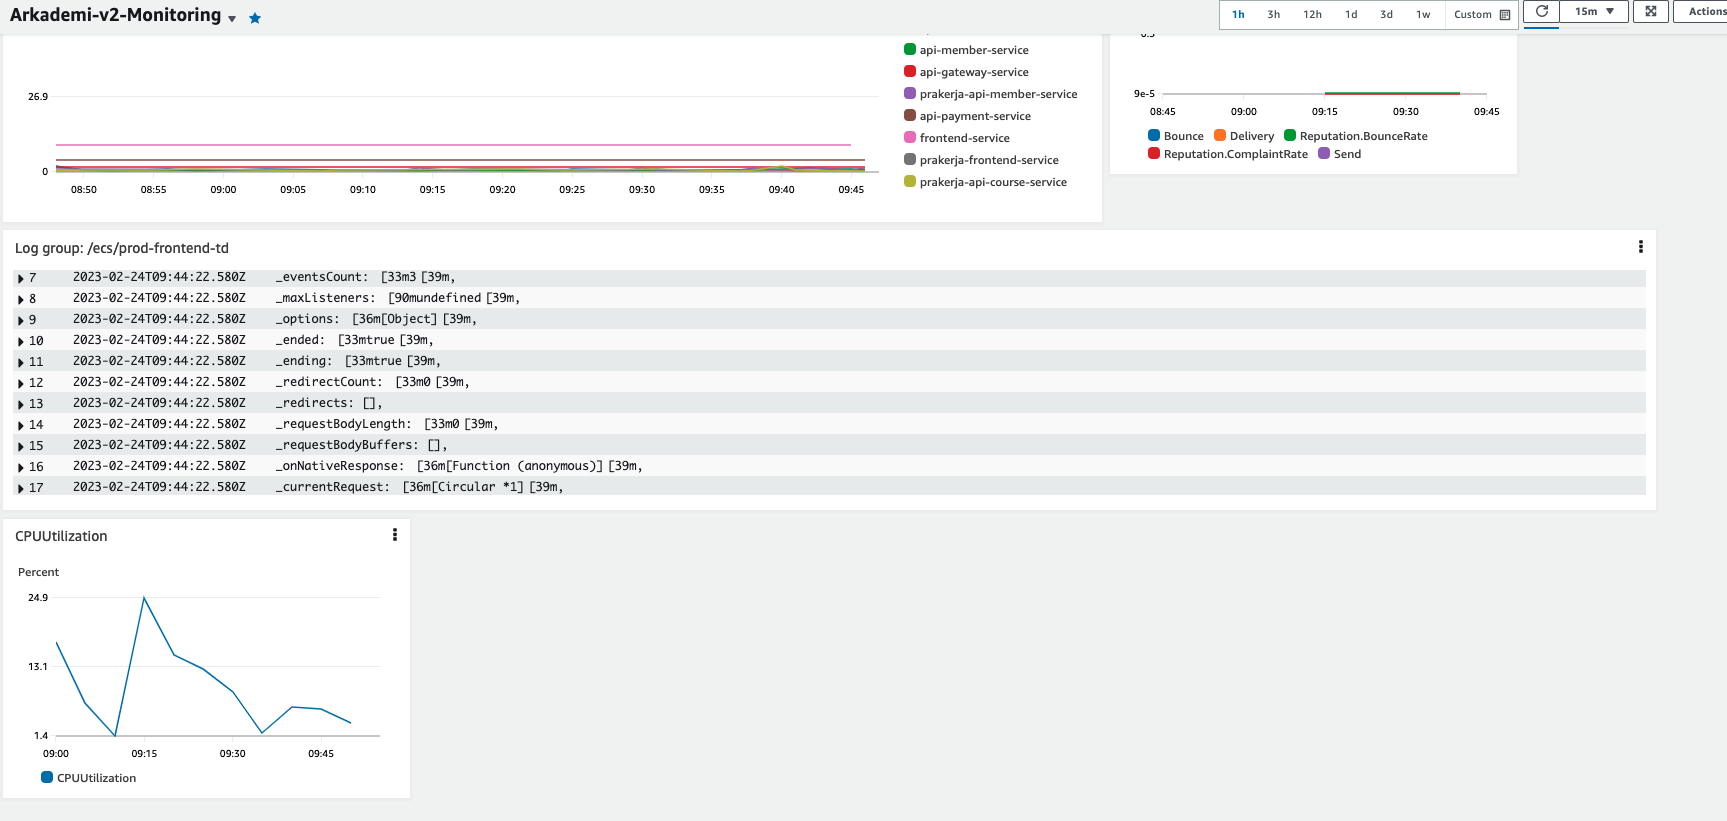
Next, if you want to change the label name of the metrics created, click edit next to the metrics name. Then change the label name, after that apply & update the widget, as shown below.
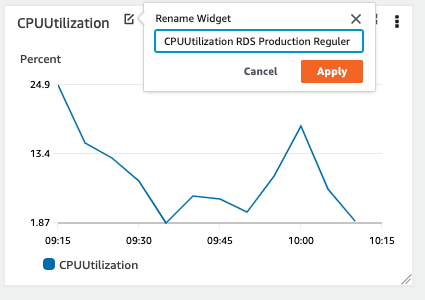
Then click apply.

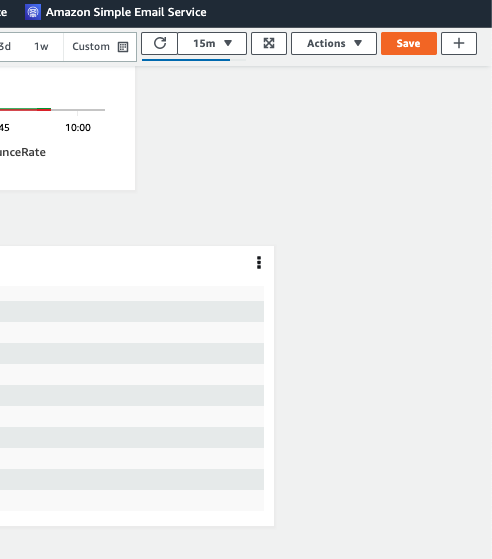
If it is done, save the dashboard.
Cloudwatch Alarm
Alarm functions as a warning if there is a service that exceeds the specified metrics limit. For example, RDS CPU exceeds 70% then aws will give a warning. The warning can be in the form of email or slack notification connected to SNS. One example of an EC2 service that has a disk usage warning is shown in the image below.
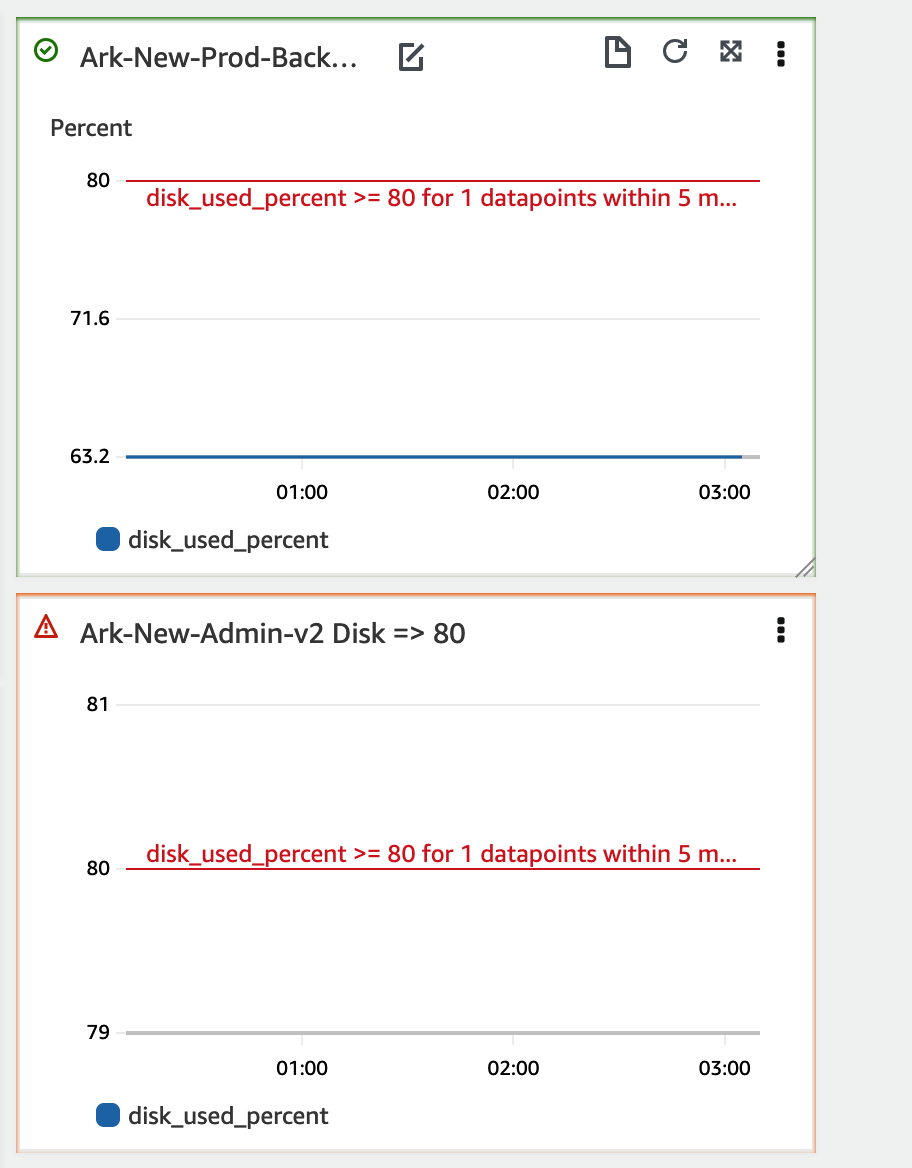
If the disk used percentage exceeds 80%, it will give a warning in forms of notifications to email, slack, etc.
Create Alarm
The first step in creating an alarm for RDS Prakerja Production is by selecting the All Alarms menu.
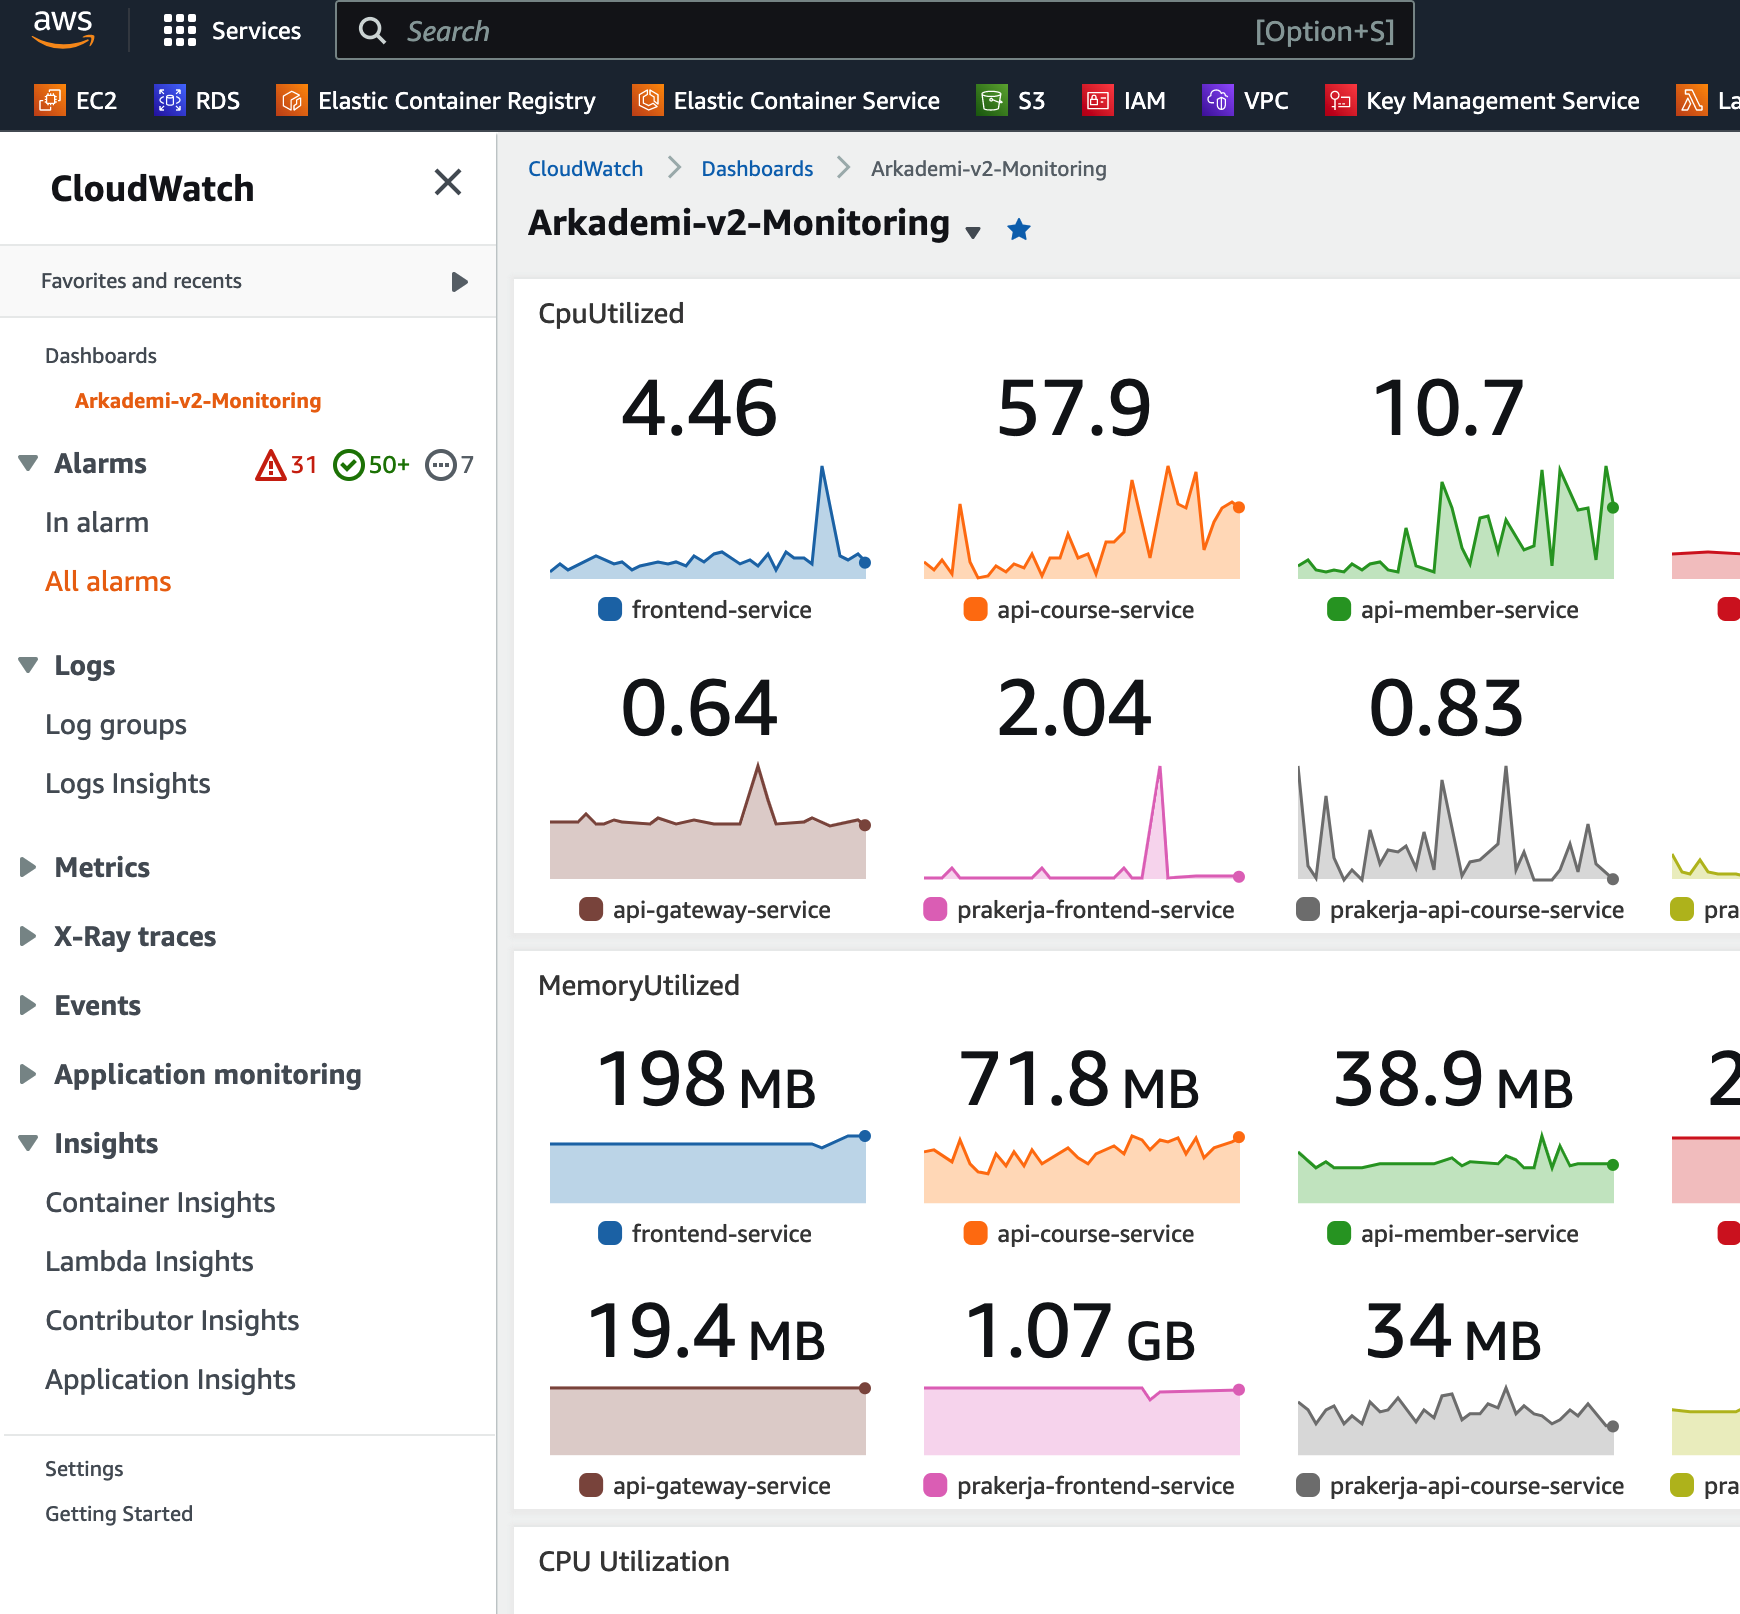
Then, choose Create alarm.

Choose Select metric.

After that, choose RDS.
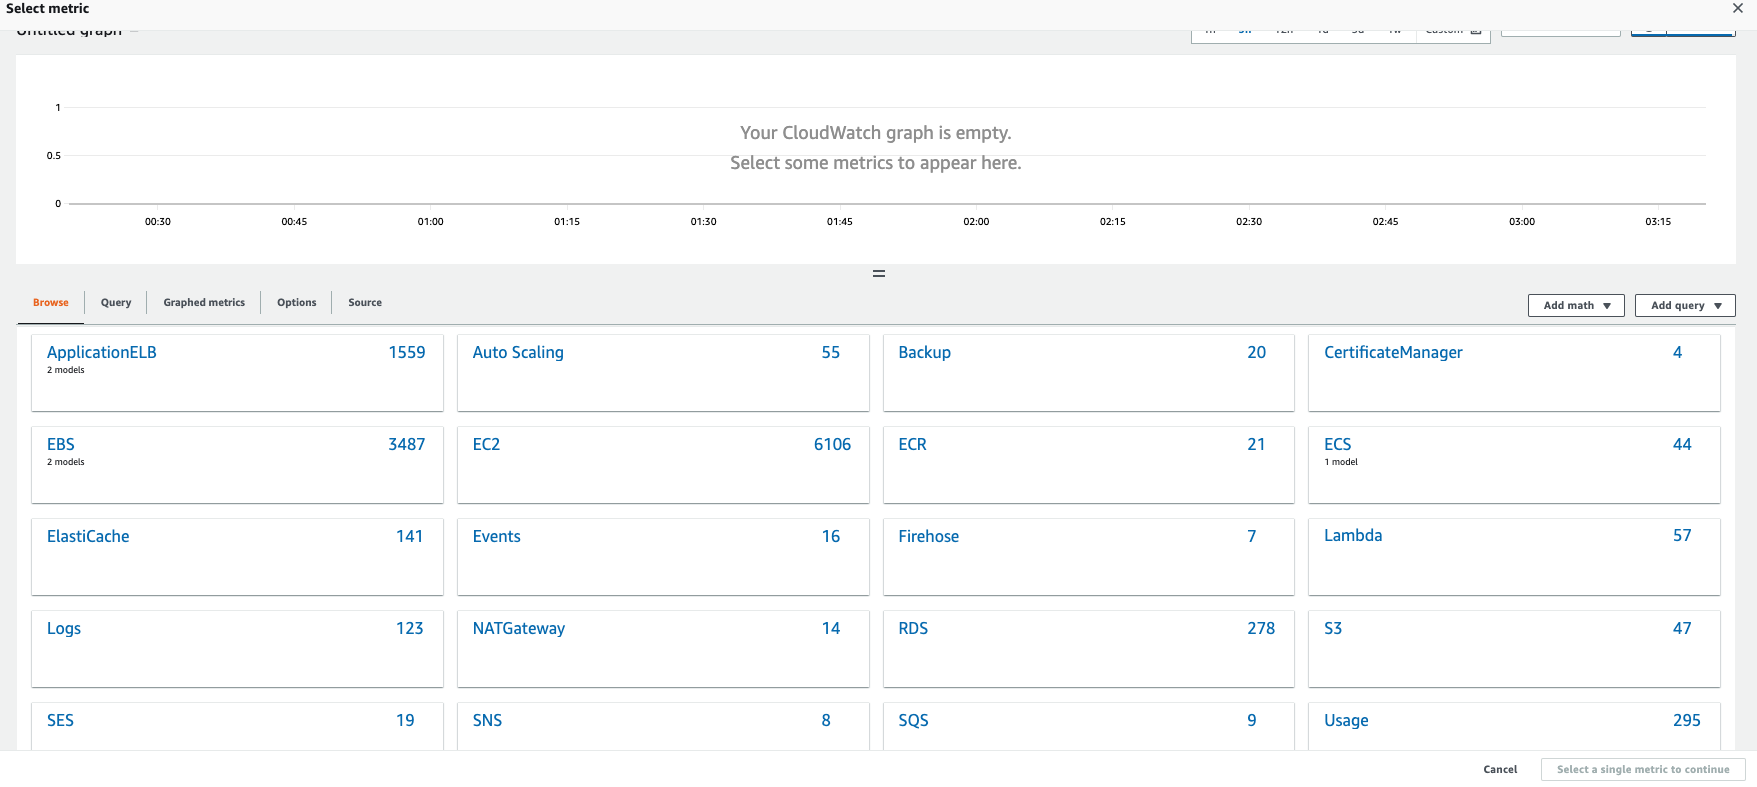
Select each database metrics.
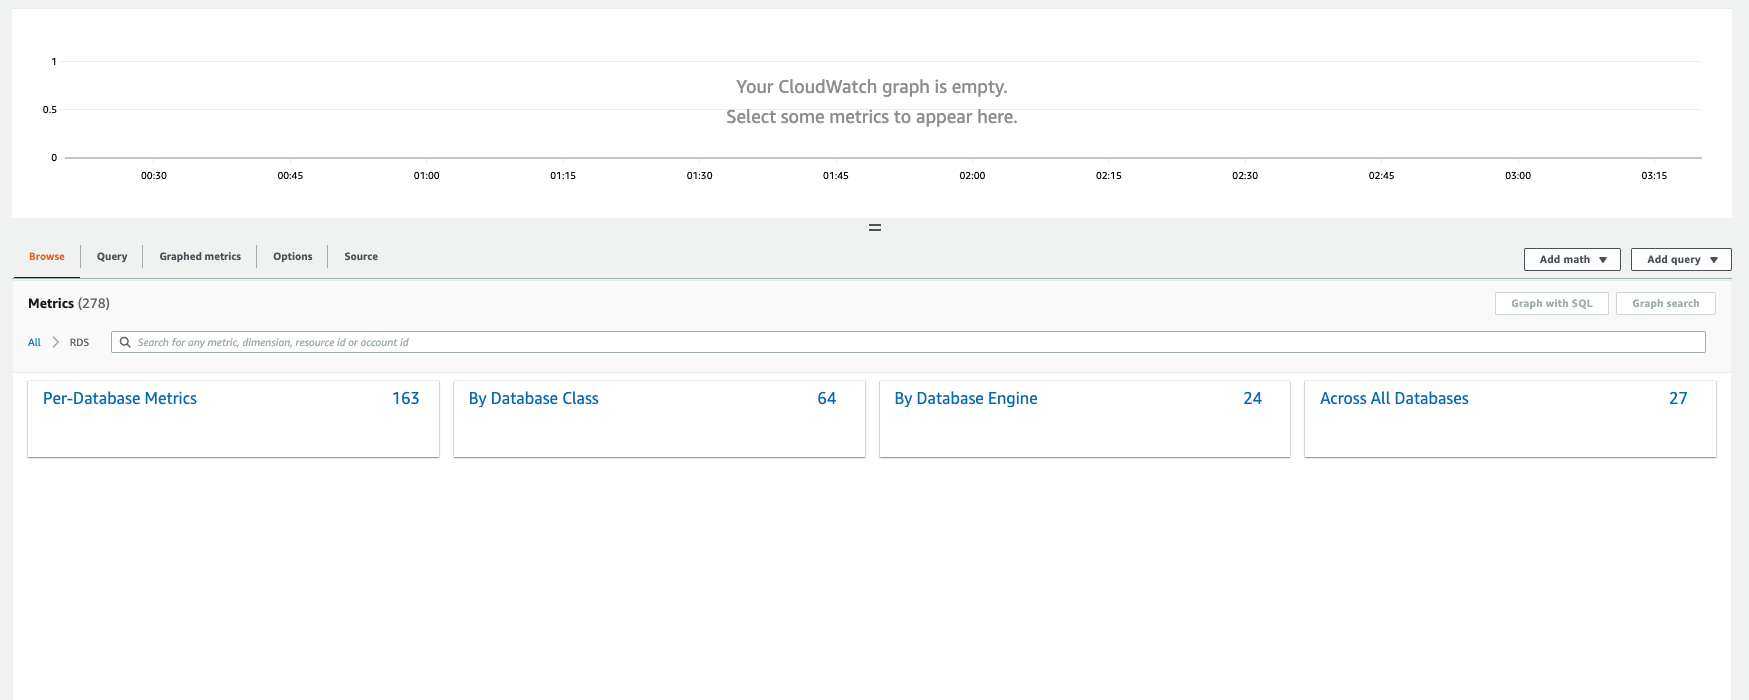
Then you can scroll search by database name and desired metrics or can do a direct search as below. And the next step is check and select the metric

Next, the display will appear as below

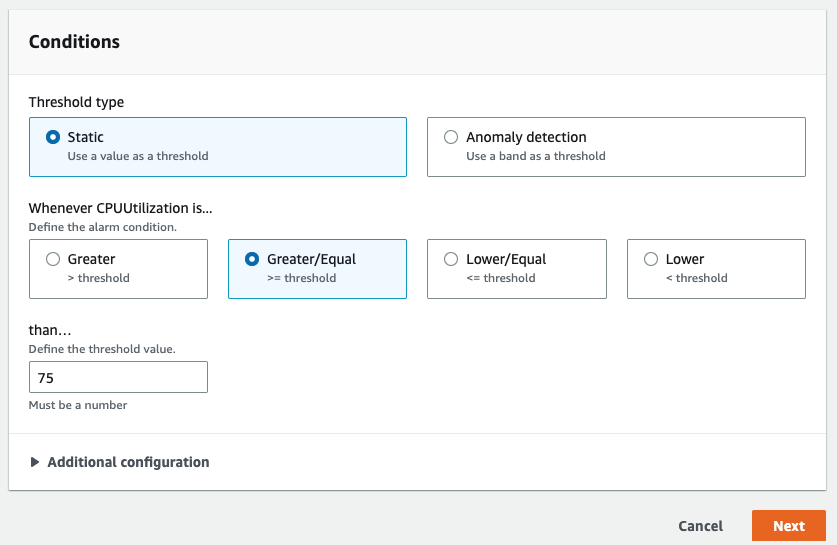
In the previous step you have used CPU Utilization metrics, actually you can set other conditions.
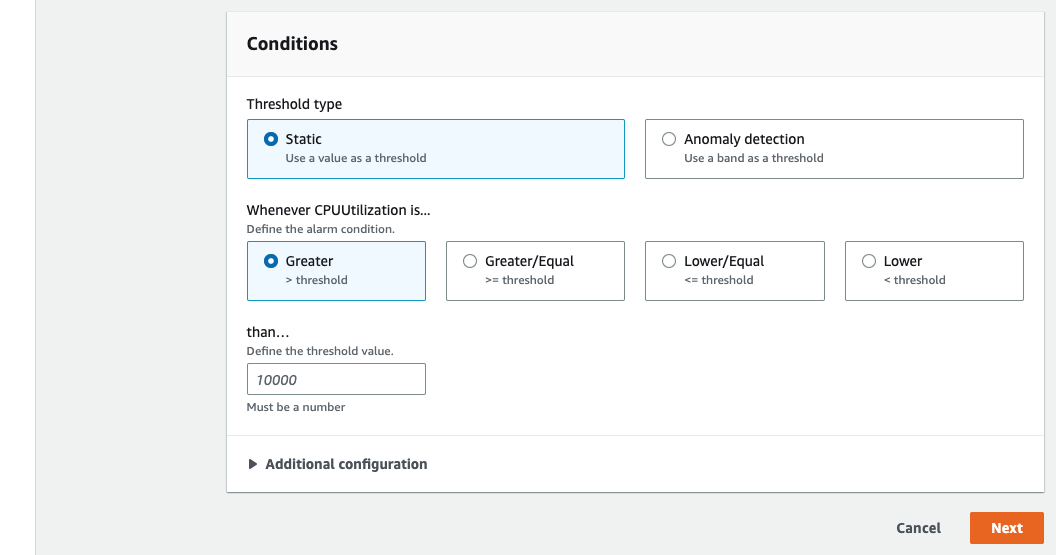
When the CPU reaches 75% or more, you can set the conditions as shown below, then click next.
After that, in the configure actions as below there will be several options.
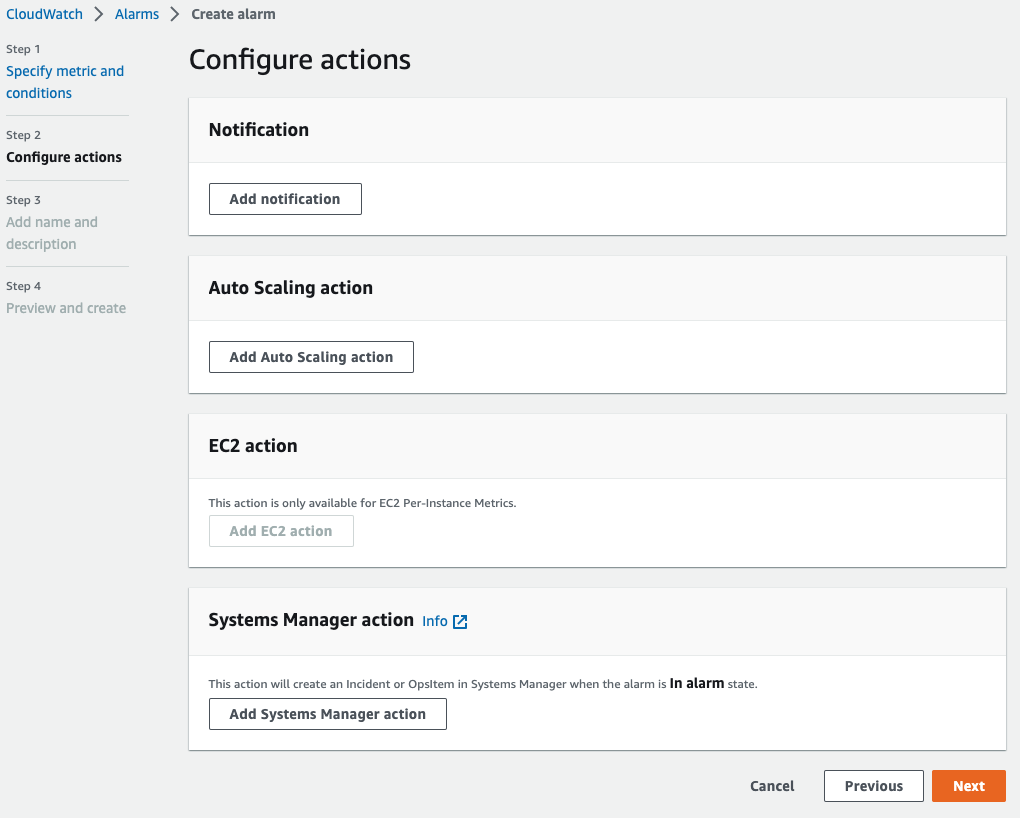
If you want to get notifications, you can select notifications and then choose add notifications.
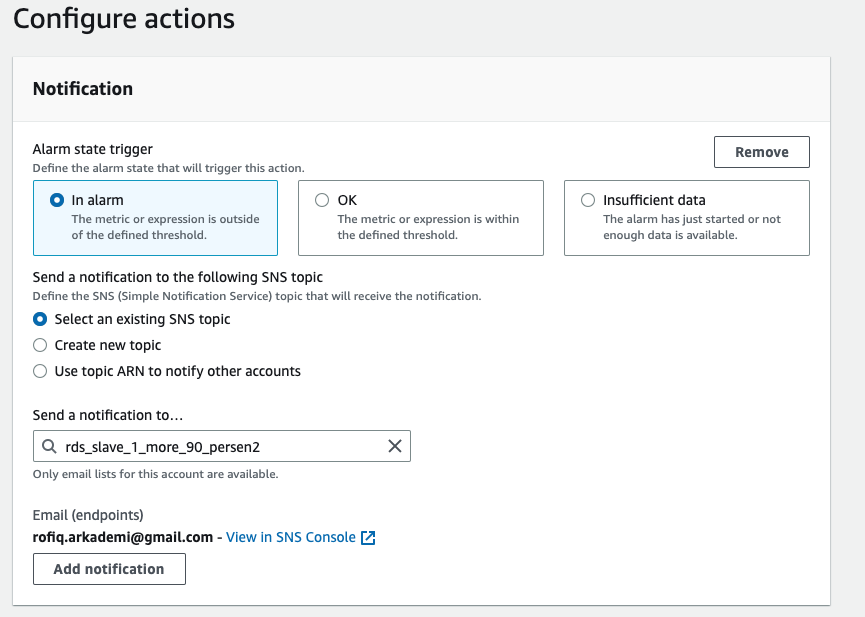
from the actions above, if the alarm state is in the "in alarm" condition, it will notify the SNS Topic. SNS topic itself can be created in SNS, which is one of the AWS services and connects the topic to your email. For example as above, we can add more than 1 user to be notified as below
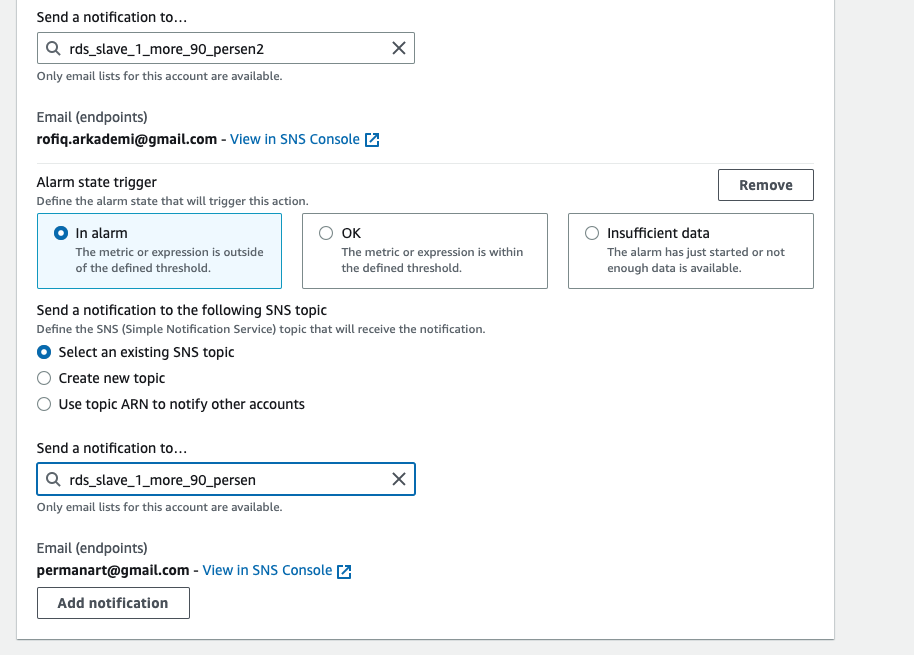
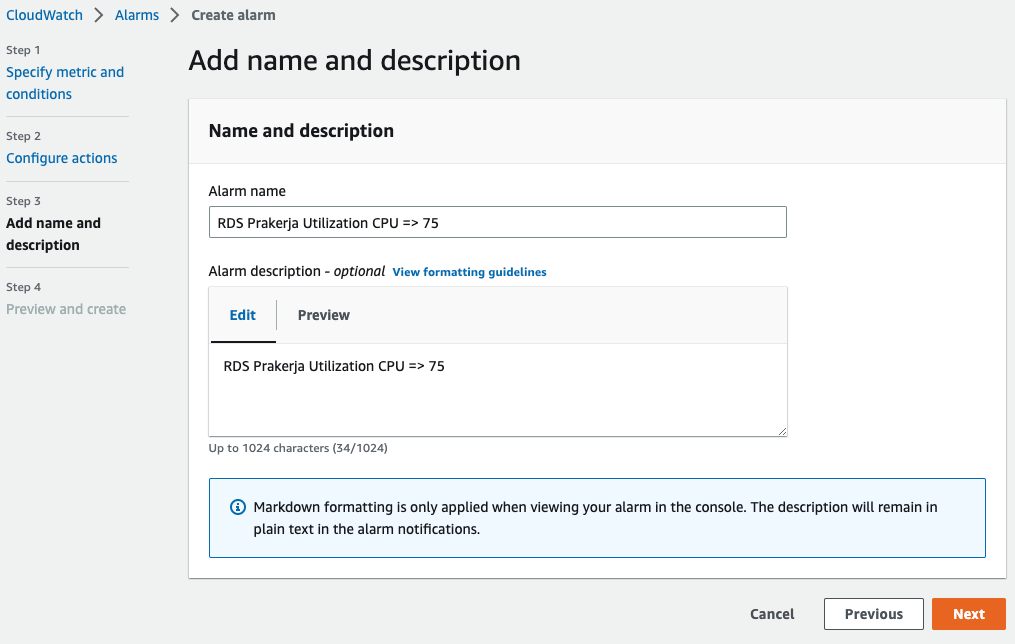
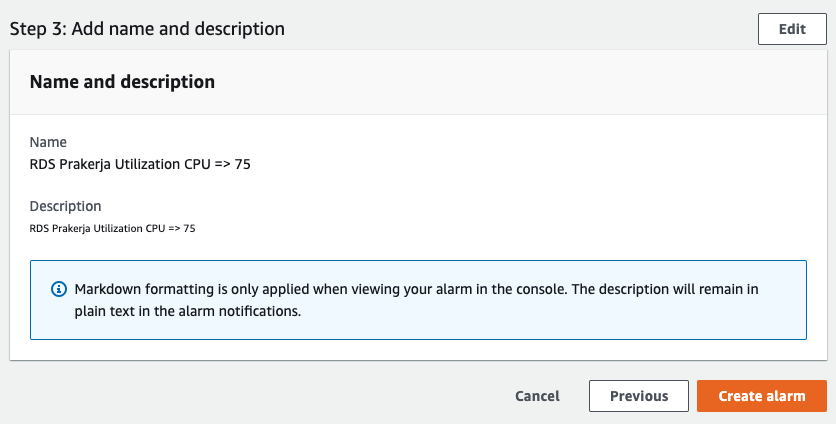
So the RDS Prakerja alarm notification will be sent to the two emails above. Then next to create a name for this alarm, give the RDS Prakerja CPU Utilization name as below, then next.
Next we go into preview & create to see if everything is in order.
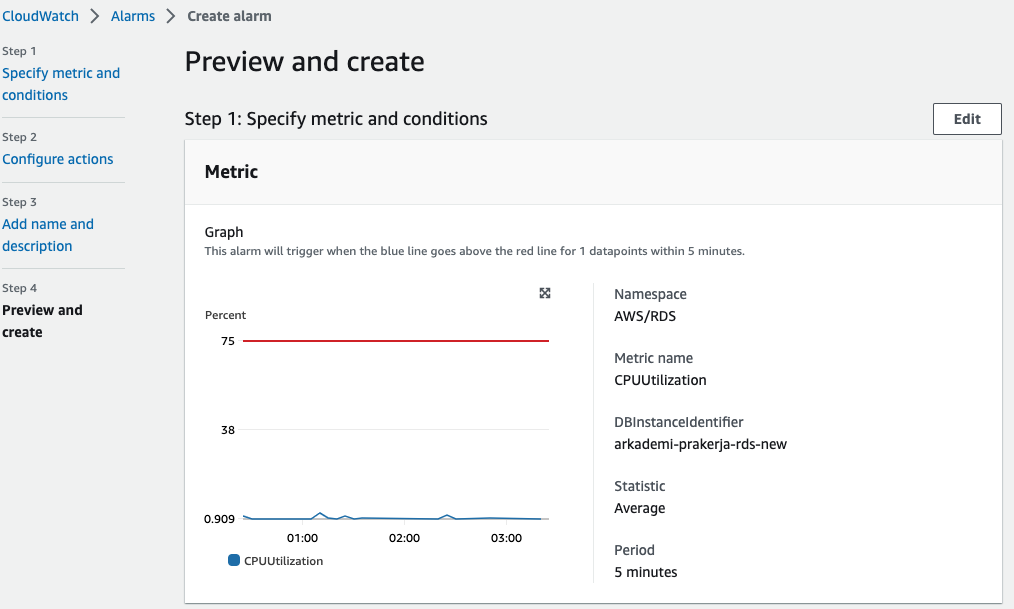
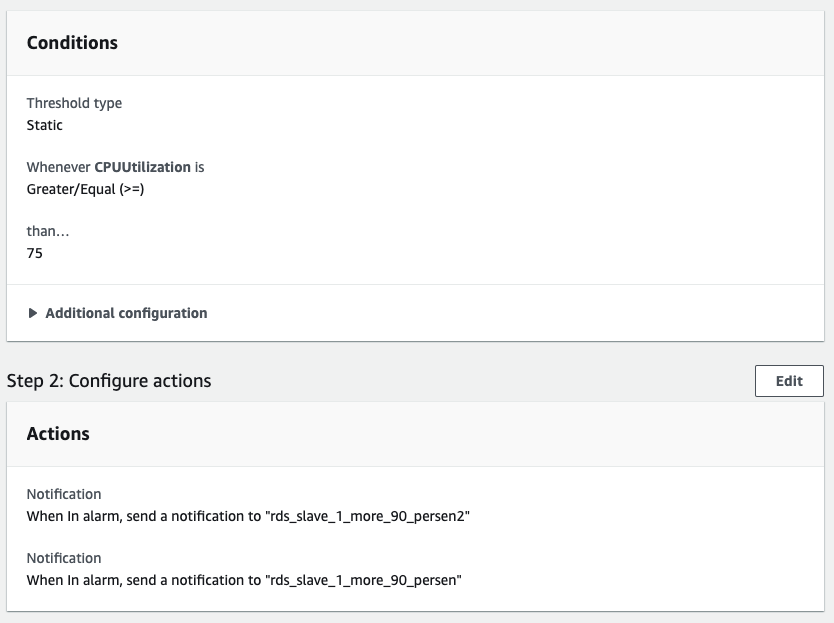
If the alarm is created, it will be done as below. Wait 5-7 minutes for the state to become OK.

- Cloudwatch alarm not only functions as a reminder if the resource used exceeds the specified limit. Alarms can be used if there is a service with resource usage that exceeds the limit for scaling, for example (EC2 & ECS).
- Scale in & Scale out will be done based on alarms.
- Cloudwatch does not necessarily provide all metrics every time you create one of the services (e.g. EC2). Cloudwatch only provides metrics in the form of CPU, Memory, Network, etc. If you want to monitor disk usage, logs, like some of the examples above, you must install CW Agent on the server (docs).